
Complete financial analysis engine
MetricFrame turns financials and customer revenue into performance trends, cohort analysis, CAC/LTV, benchmarking, an executive summary, and a live Excel model
Explore live sample data. No signup required.
How it works
Upload
Upload financials and customer revenue; no template required
Review
Review and edit AI-proposed normalization and categorization
Generate
Generate a full analysis across multiple views
Summarize & Export
Generate an executive summary, live Excel model, and build your benchmark library
Analysis outputs
Every view is built from the same normalized data
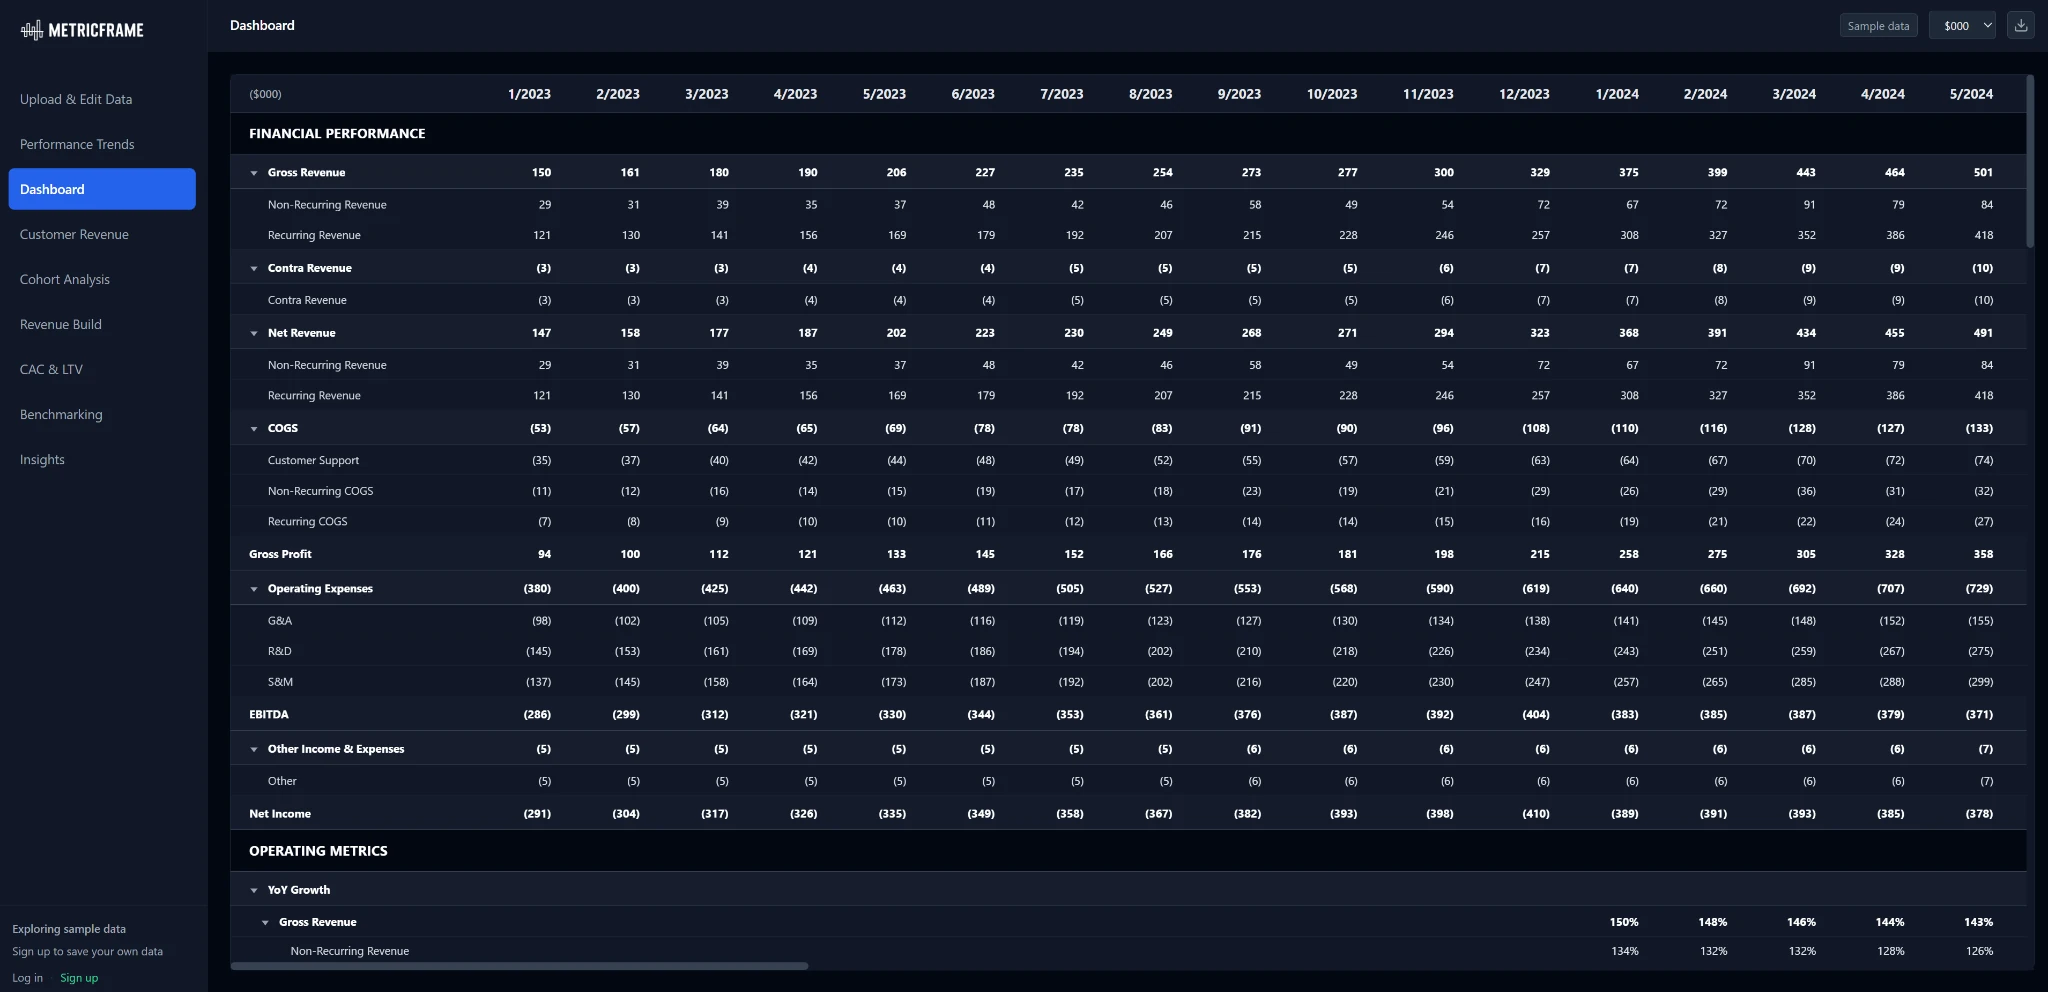
Dashboard & Financials
Spreadsheet view of financials and dynamic operating metrics, including margins, growth, and efficiency KPIs
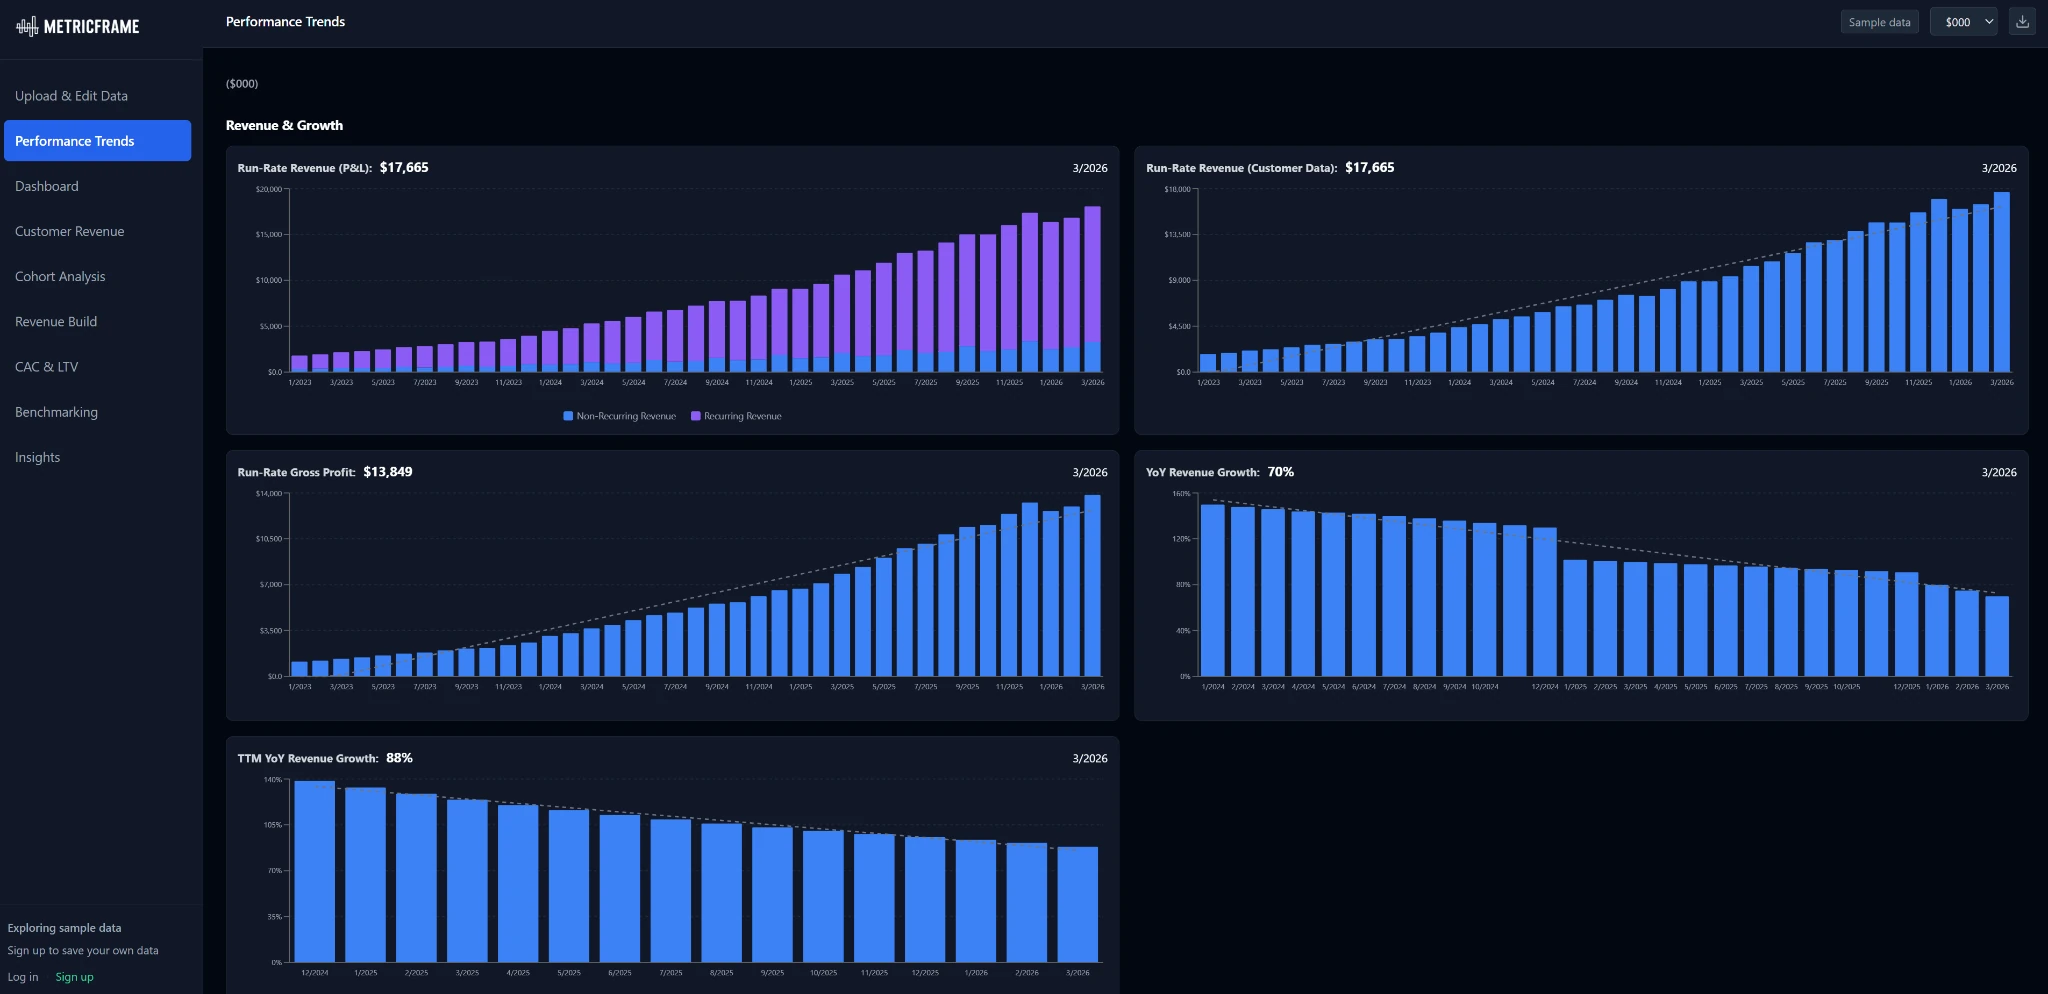
Performance Trends
KPI charts across revenue, growth, profitability, cash, customers, and retention
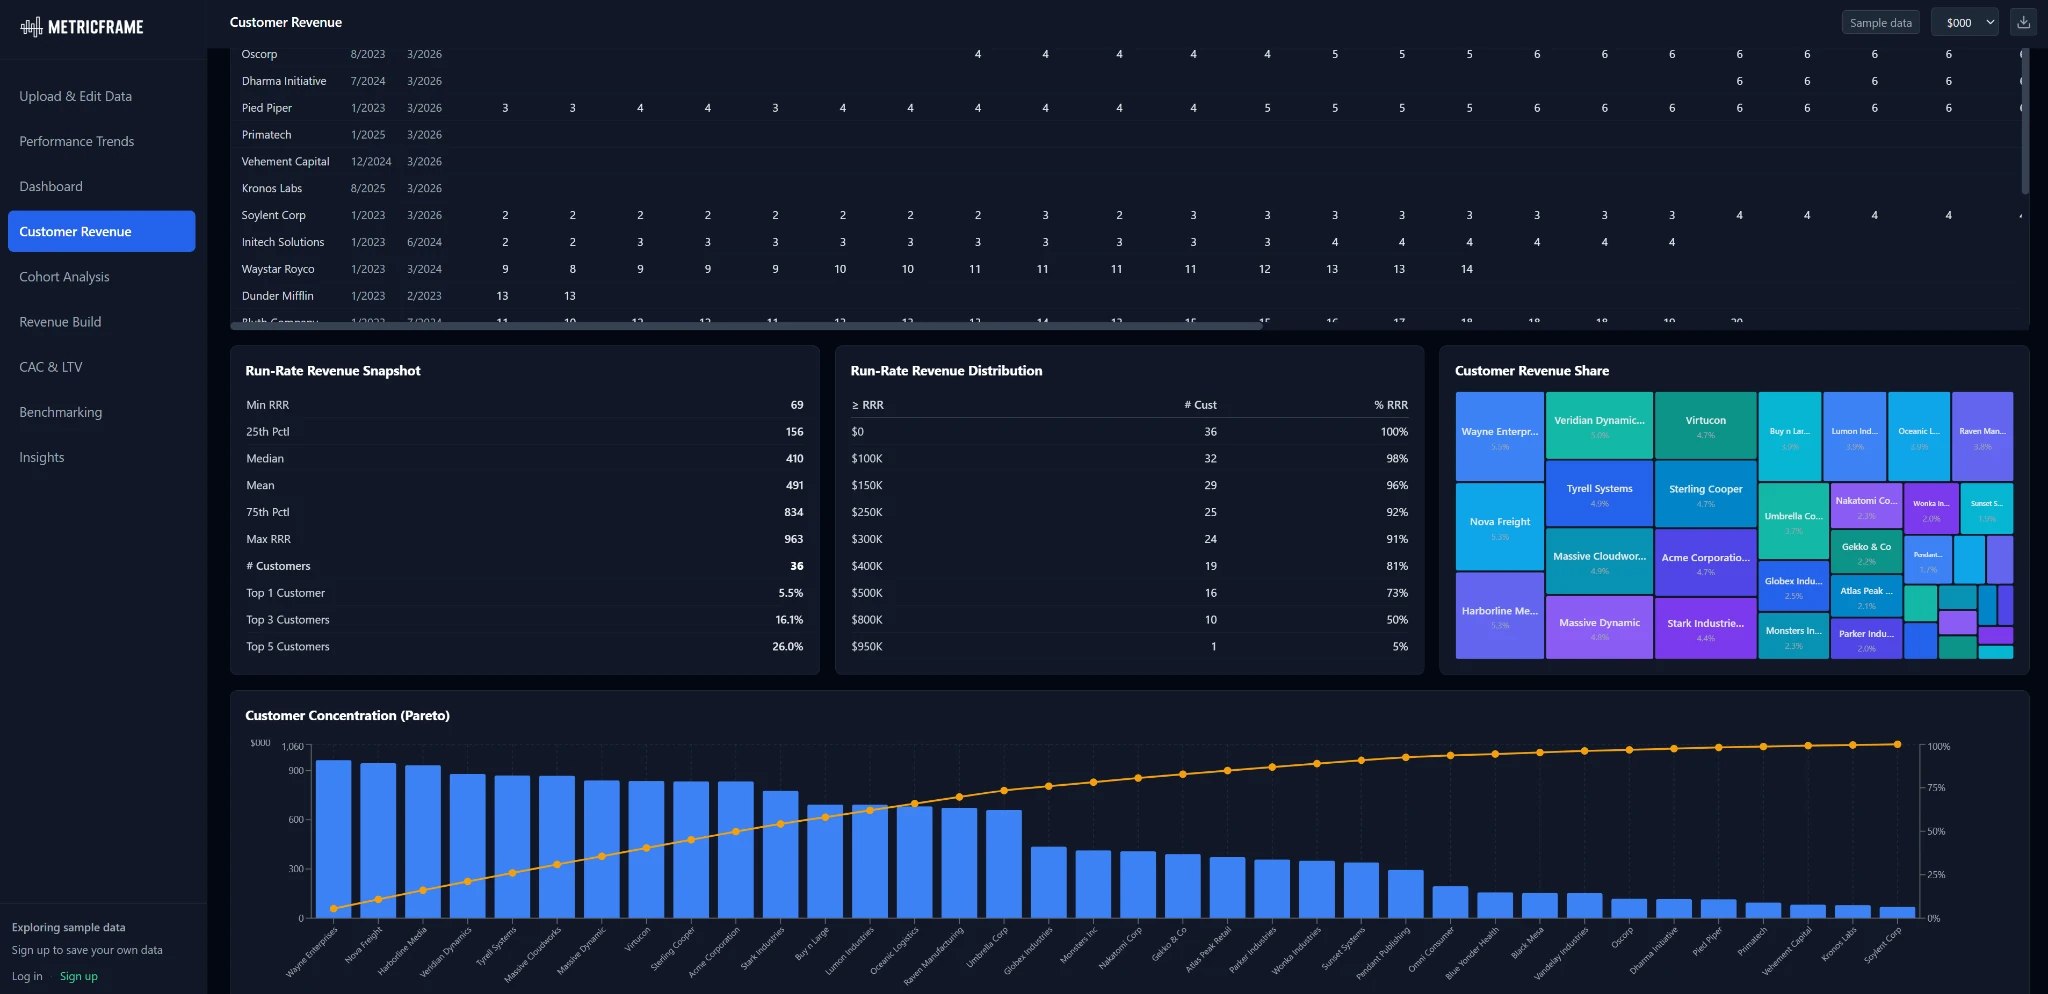
Customer & Revenue Analysis
Customer-level revenue, ACVs, concentration, and segment views. Revenue movement across new, expansion, contraction, churn, and resurrection
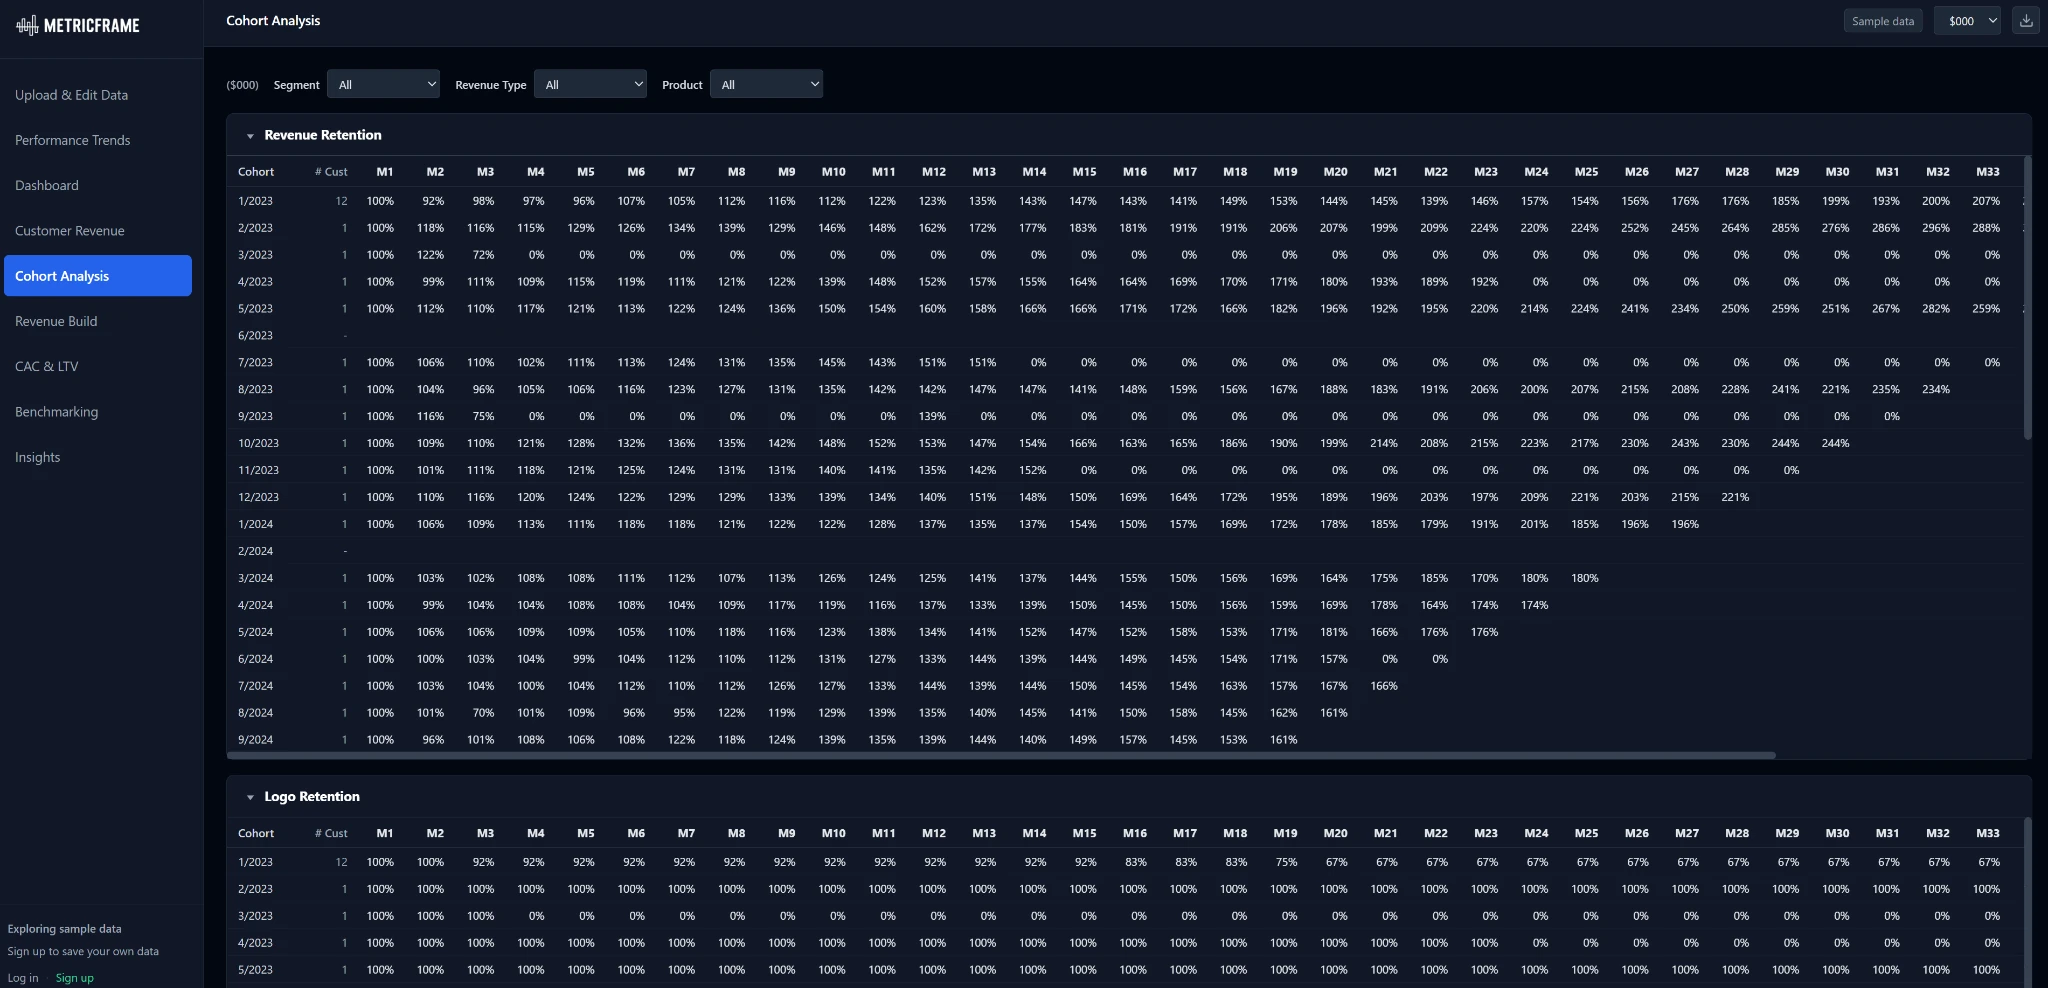
Cohort Analysis
Revenue and logo retention, cumulative revenue per customer, and layer cake and cross-section views across customer segments
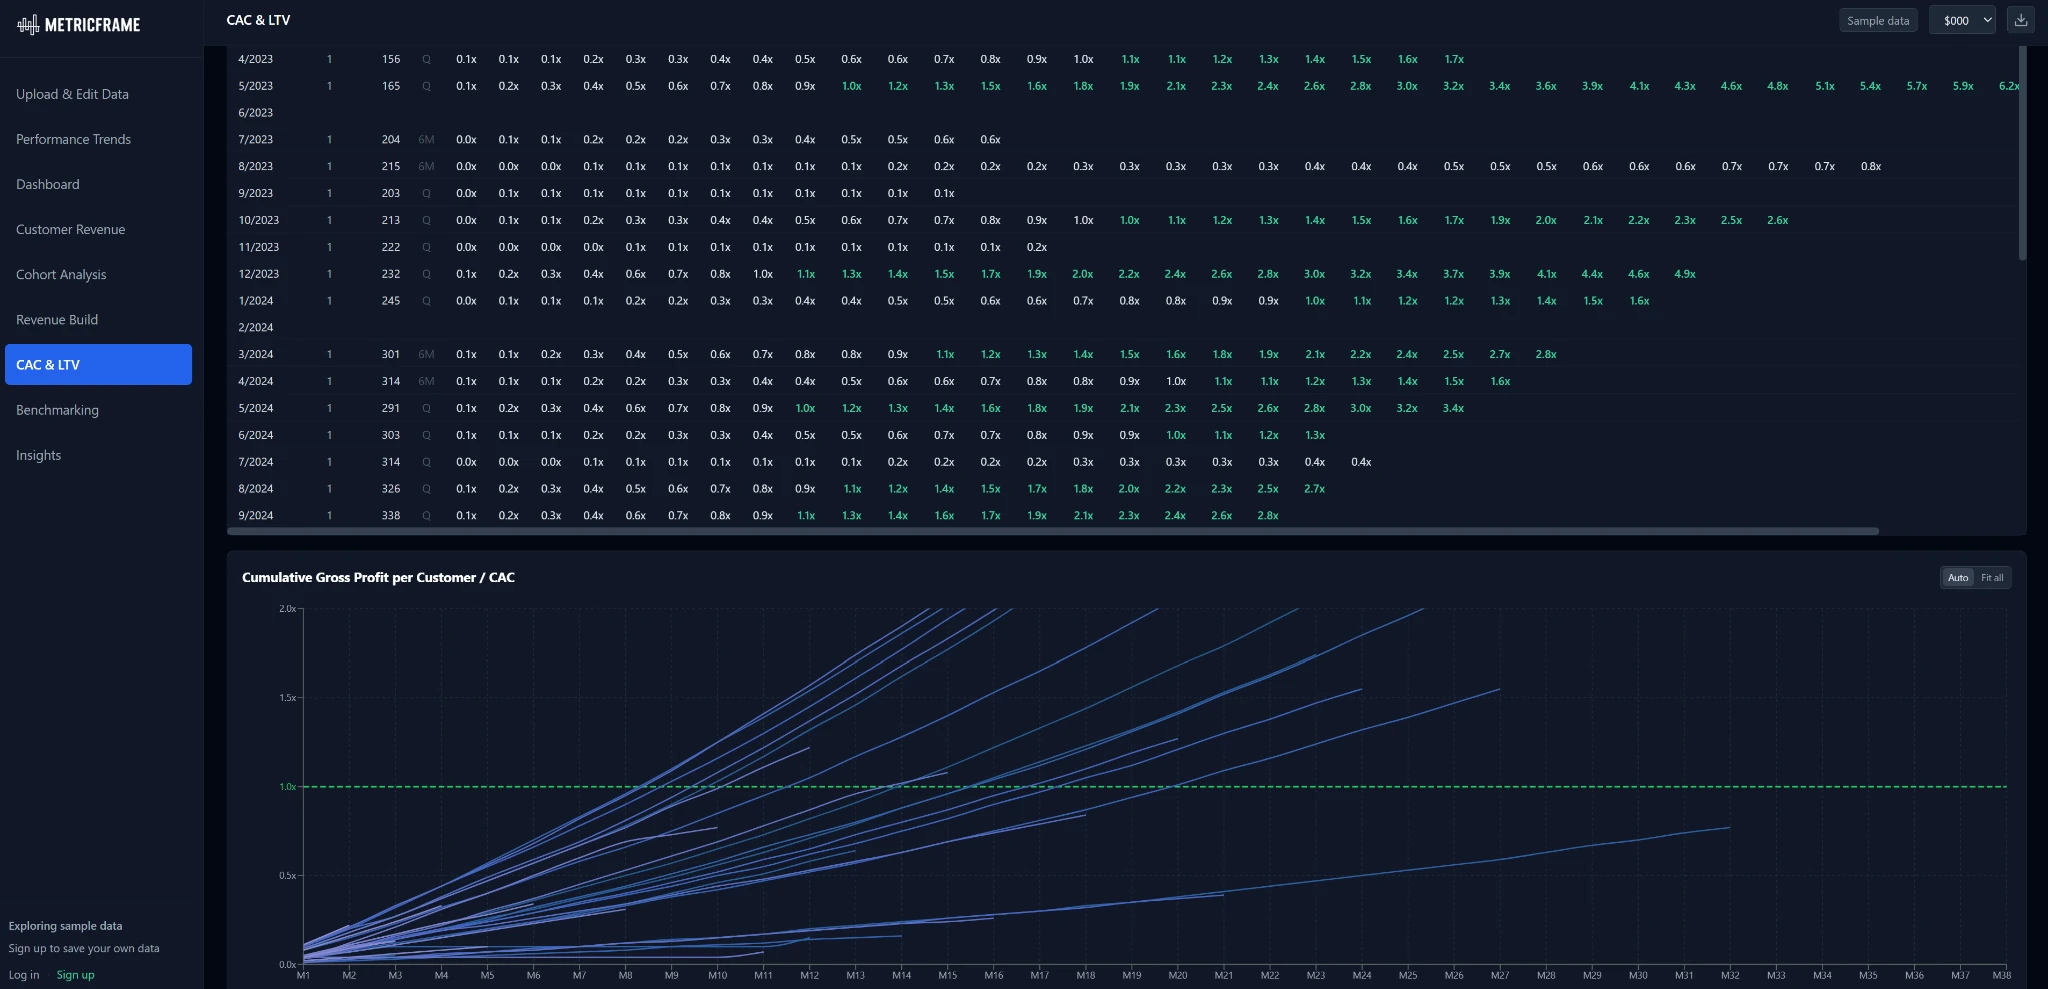
CAC, LTV & Payback
Multi-period CAC, cohort payback curves, LTV/CAC, observed cohort LTV, and implied lifespan
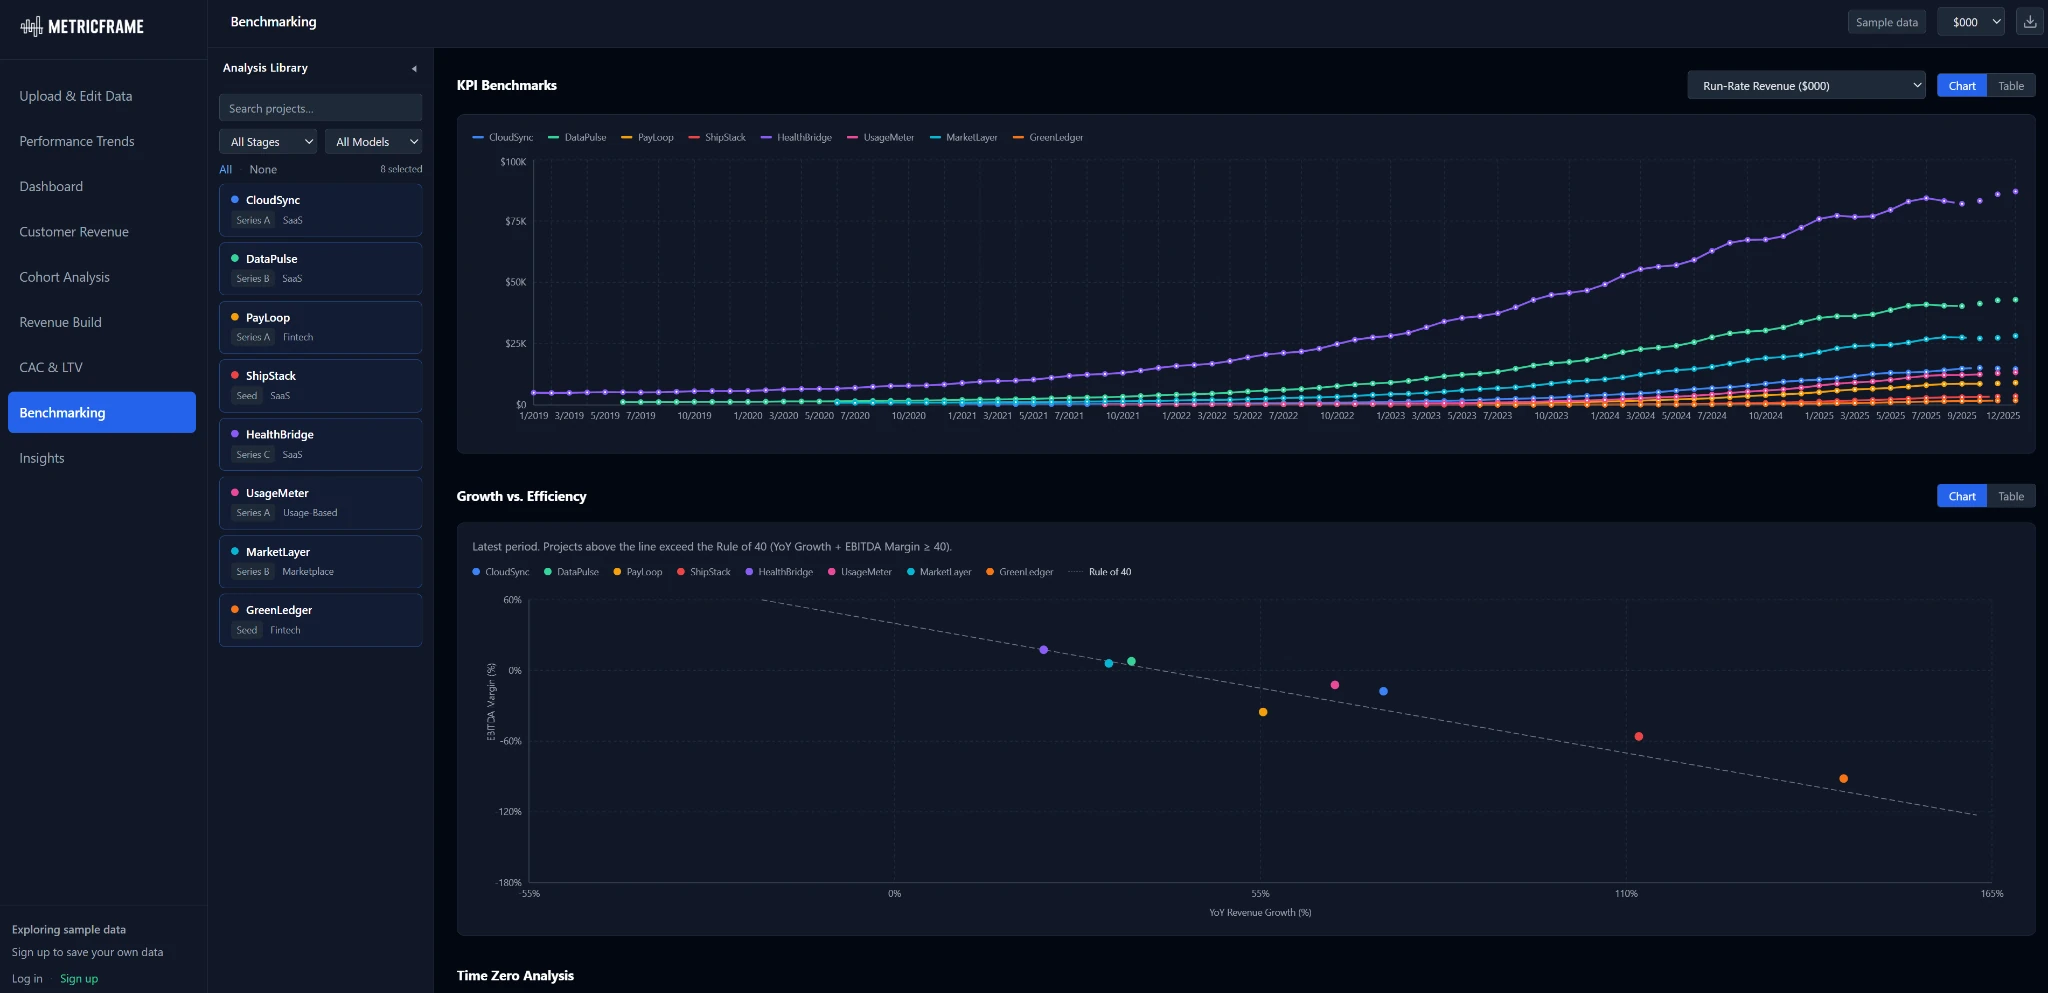
Benchmarking
Compare KPIs across saved analyses and expand a private benchmark library with every analysis
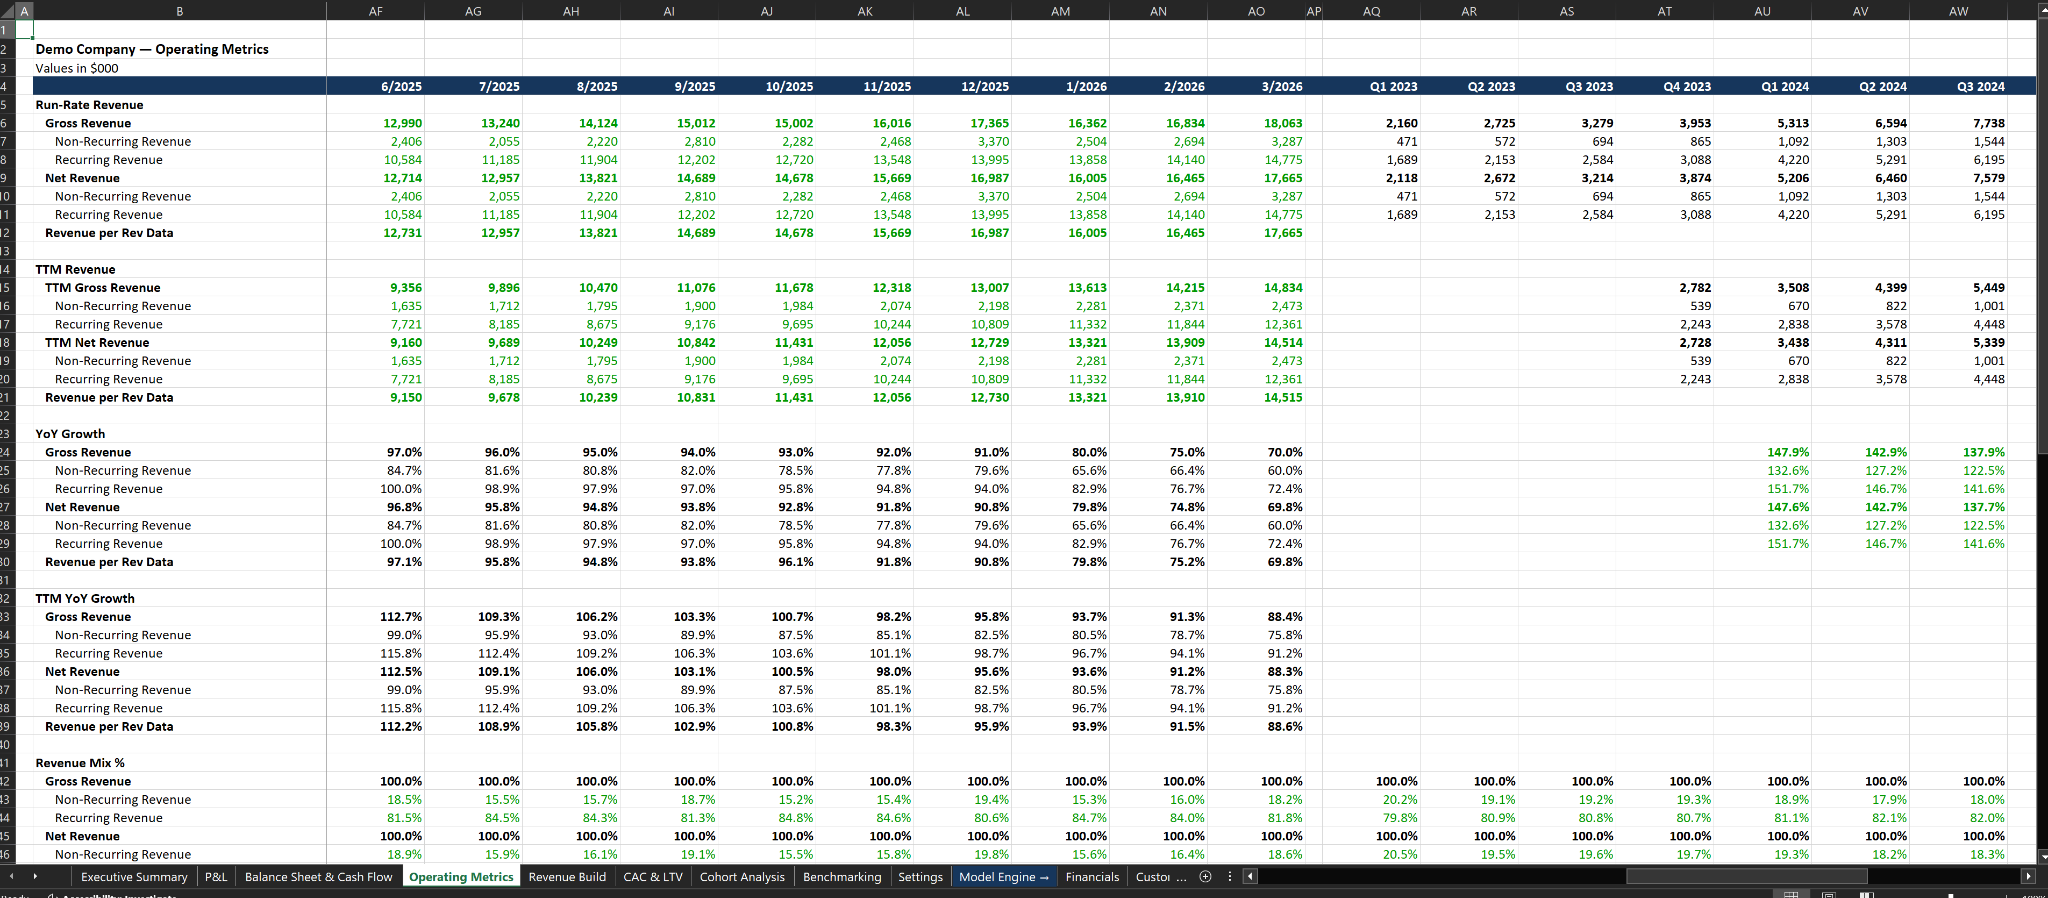
Executive Summary & Live Excel Model
Executive summary of the strongest signals, key risks, and open questions, plus a working, formula-linked Excel model you can extend
Who it's for
Built for teams that need repeatable financial analysis
VCs & family offices
Investment screening, diligence, portfolio review, and benchmarking
SaaS CFOs & finance leaders
Board, fundraising, and executive reporting
Fractional CFOs & consultants
Repeatable analysis across clients
See it on your own data
Bring a real reporting pack. We'll run it live. You keep the model.